By: Maged Mohamed, Ph.D., Kevin Chang, Ph.D., P.E., Ahmed Abdel-Rahim, Ph.D., P.E., Emad Kassem, Ph.D., P.E., and Armando G. McDonald, Ph.D.
Pavement markings facilitate roadway users by providing important visual cues, so the durability and weatherability of these products must be carefully monitored. Since current performance evaluation methodology using National Transportation Product Evaluation Program (NTPEP) test-deck protocols consumes significant field time and effort, an accelerated laboratory-based procedure was developed to replicate traffic, snowplowing, and weather conditions, and to evaluate the performance of different pavement marking products. The results provide guidance to transportation agencies who select and maintain pavement markings and to researchers studying pavement markings as they relate to road safety.
Evaluating pavement markings
Maintaining suitable visibility of pavement markings is needed for the safety of road users. DOTs use different pavement marking products based on local conditions. The service life of pavement markings varies by location, and each material has its own unique characteristics depending on pavement surface, climate, and operating conditions. Waterborne paint has a shorter service life compared to other marking materials such as thermoplastic, but is the most commonly used delineation material—especially on rural roads—due to its affordability, availability, and eco-friendly attributes. However, waterborne markings—also known as nondurable markings—require regular re-striping while thermoplastic, or durable, markings last comparably longer in service.
Several specifications for pavement marking materials are issued by the American Association of State Highway and Transportation Officials (AASHTO), American Society for Testing and Materials (ASTM), and other agencies. Each DOT has developed its own methodology for choosing adequate pavement marking materials. These methodologies depend on factors such as line type, pavement surface type, traffic volume, material service life, and climate.
Several limitations potentially undermine the NTPEP test-deck evaluation method. Even though NTPEP test-deck provides factual performance assessment of pavement markings under service conditions, three years or longer may be required to complete the test. The development of alternative performance evaluation protocols, including accelerated laboratory-based testing to effectively evaluate pavement markings in a shorter time frame, thus has potential time and cost savings.
Replicating the real world
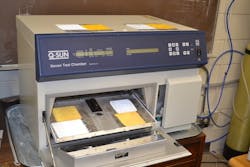
Pavement markings are naturally exposed to different climatic conditions, road maintenance activities, and varying traffic conditions. The degradation of pavement markings in terms of selected evaluation measures was determined by exposing waterborne and thermoplastic pavement markings to different dynamic loadings using a three-wheel polisher device (TWPD) and to weathering using a xenon arc chamber (Figure 1). To place the marking samples in the two devices, two different substrates were prepared (asphalt slabs and aluminum plates) and were striped with white and yellow color from each material with support from the Idaho Transportation Department.
Based on the potential of using the TWPD to model pavement marking degradation, simulated field testing using a TWPD was conducted at various operating conditions using pneumatic tires, steel wheels, and a scraper blade (to simulate snowplowing) to examine the effects of accelerated loading conditions (Figure 2). The second procedure used a xenon arc chamber to accelerate and examine the effect of sunlight, temperature, and moisture on pavement marking degradation.
Twenty-inch square asphalt slabs with a thickness of 2 in. were prepared and then striped with waterborne and thermoplastic pavement markings. Aluminum plates (7 in. x 4 in. x 0.2 in.) were also striped using the test pavement markings for use in the xenon arc chamber.
The TWPD was used to polish the marking samples and assess the pavement marking materials’ performance under different loading conditions. The TWPD utilized three tires, tracking in an 11.2-in. diameter circle. In this study, all painted asphalt substrates were subjected to wet accelerated wear testing at room temperature up to 100,000 cycle intervals.
A xenon arc chamber was employed to simulate weathering of the pavement marking samples. A digital microscopy analysis was conducted before and after weathering to investigate color change and examine surface texture changes such as peeling, cracking, and any changes to the structure of the pavement marking components.
To assess the degradation of pavement markings, three performance measures were examined:
- Retroreflectivity in dry (RL), recovery (RL1), and continuous wetting (RL2) were conducted using a retroreflectometer, and multiple readings from different locations on the wheel path were recorded.
- Color measurements of each surface were conducted using a portable colorimeter. The total change in color (∆Eab) and the change in lightness (∆L) were determined.
- Presence performance (durability) was assessed using an image processing software and high-resolution camera to evaluate laboratory pavement-marking performance by determining pavement marking material loss and surface texture change.
How did it go?
Performance under Accelerated Load Testing: Changes in retroreflectivity were evaluated under three conditions (i.e., RL, RL1, and RL2) for the two colors (i.e., white and yellow) of waterborne and thermoplastic materials under different operating conditions (i.e., steel wheels, pneumatic wheels, and scraper blade).
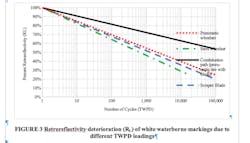
As an example, Figure 3 shows the dry percent retroreflectivity measurement (RL) against the number of cycles for different wheelsets using white waterborne markings. The drop in retroreflectivity was significant over the first 1,000 cycles followed by a relatively small reduction in percent retroreflectivity between 10,000 to 100,000 cycles. Similar trends were identified for the change in RL1 of the white and yellow markings (measurement simulating marking retroreflectivity performance in situations where dew was present, or after rain) and RL2 (measurement simulating marking retroreflectivity performance during rain).
The thermoplastic marking retroreflectivity during RL1 and RL2 conditions showed better performance under steel wheelset loadings due to the thicker binder material. By comparison, the waterborne marking performance performed better under most scraper blade loading cases. Also, several mathematical models were examined to assess retroreflectivity decay with the number of performance cycles, and the logarithmic model was found to provide the highest coefficient of determination (R2) value for the test data.
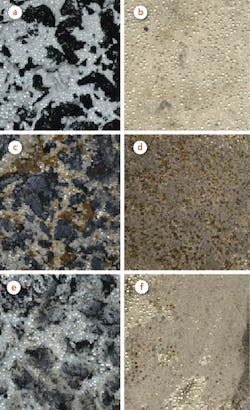
Based on TWPD testing, each wheelset type uniquely affected retroreflectivity deterioration. The pneumatic tires abraded large paint flakes holding the glass beads, but no significant changes were observed in the surface texture of the thermoplastic marking (Figure 4a and 4b). The steel wheelset crushed and extracted most of the glass beads of the waterborne markings while crushing and extracting fewer glass beads from the thermoplastic material due to the stronger cohesion between the glass beads and the binding material (Figure 4c and 4d). The blade only scraped the waterborne paint from the upper peaks of the pavement texture but could not largely affect the lower valleys (Figure 4e), while the blade scraped most of the glass beads on the thermoplastic markings because of the flatter surface (Figure 4f).
The total color change (∆Eab) and the changes in lightness (∆L) of white and yellow waterborne and thermoplastic surfaces at different loading conditions were examined. No significant difference in color was noticed when using pneumatic tires on the thermoplastic markings while a logarithmic difference was noticed in both ∆Eab and ∆L of the waterborne markings. The steel wheelset had the highest ∆Eab and ∆L after loading, a likely result caused by compaction rather than wearing. The ∆Eab and ∆L of the waterborne and thermoplastic markings resulting from the blade had a similar trend but with higher values for waterborne markings.
After loading, the yellow color of both materials showed larger color differences than the white color, while the difference in lightness of the white color was larger. With regard to percent retroreflectivity, initial traffic loading of marking surfaces resulted in obvious color darkening, and further traffic loading caused stability in color and lightness. During the waterborne testing, the asphalt color played a major role in darkening the marking surface color while the accumulation of debris on the top surface had the same role with thermoplastic markings.
Performance under Accelerated Weathering: Accelerated weathering tests were conducted using the weatherometer. Unlike the TWPD results, an initial increase in percent retroreflectivity was noticed in all marking samples after the accelerated weathering exposure.
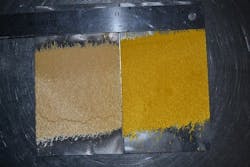
Pavement markings become stiff and crack over time, resulting in bond failures and blow-offs. The same phenomenon was observed under accelerated weathering testing, and all marking binders became stiff. The waterborne binder started disbanding from the aluminum substrates because of cracking but did not entirely break the paint (Figure 5a); no cracks appeared in the thermoplastic binder due to the thicker binder layer. Figure 5b shows a marking sample before and after 2,000 hours of weathering exposure. With extensive exposure in the weatherometer, the white markings of both marking materials slightly darkened, while the yellow markings faded.
Lab testing takeaways
Current standards for evaluation of pavement marking performance is based heavily on the test-deck methodology. This method requires significant time and resources in addition to safety-related issues such as exposing technical staff to dangerous field activities. In this study, the feasibility and validity of a laboratory-based evaluation procedure for pavement marking performance were assessed to replicate field testing. The performance of both waterborne and thermoplastic pavement markings was modeled using two laboratory protocols which replicated and accelerated the testing procedure for: 1) traffic and snowplowing action using the TWPD, and 2) weathering using a weatherometer. Retroreflectivity, color retention, and durability were used as performance measures to validate the correlation results. The following conclusions were drawn:
- The three-wheel polisher device effectively simulated and accelerated traffic and snowplowing action to study and evaluate pavement marking performance.
- The retroreflectivity decay function followed a logarithmic function for the tested marking materials.
- The weatherometer successfully reproduced climatic effects to study and evaluate pavement marking performance in an abbreviated timeframe.
- The procedure described in this study can be used to efficiently simulate surrounding factors similar to the test deck. This procedure is advantageous since it can be less expensive, easier to operate, and take less time to complete.
---------------
