By: Brian Hirt
A single grain of salt weighs mere milligrams, but numbers add up quickly in the winter maintenance world.
States measure annual salt use by the ton. A fleet of plow trucks can be in the thousands. A state’s annual winter maintenance expenses are typically in the tens (or hundreds) of millions of dollars. In light of these dizzying figures, winter maintenance is necessarily a data-driven enterprise. The more that transportation agencies know about their own systems—and those of states across the border or across the nation—the better they can make important decisions about purchasing, planning and policy-making.
We’re paying how much for salt?
The Clear Roads consortium of 31 state departments of transportation (DOTs) has investigated a wide range of topics related to winter maintenance since 2005. In the last decade, and even before Clear Roads’ formation, state DOTs have called upon one another to collect information about their winter maintenance operations.
An early motivator was the cost of road salt. According to Jay Wells, maintenance operations staff assistant for the Washington State Department of Transportation (WSDOT), the question came all the way from the director’s office: Why is our agency paying so much for salt?
“The first step in answering that,” Wells said, “was finding out where we stood in the national landscape—not just how much we use and what we spend, but what about other states?” As it turns out, many of these same states wanted this information as well, and WSDOT’s efforts to collect salt use and cost data from state DOTs for years became an annual effort.
Wells’ colleague James Morin, WSDOT maintenance operations manager, said, “The results were eye-opening for Washington. The national map and trends helped us understand the interplay between salt costs, usage amounts and shipping distances. These insights put us in the best possible position for decision-making and contracting.”
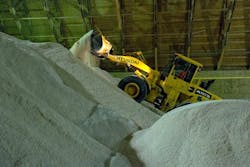
Snow-and-ice control chemicals are a big line item for many DOTs. The Clear Roads survey puts it into perspective. Courtesy Pennsylvania Department of Transportation.
The whole picture
In effort to not limit themselves to salt data alone, state DOTs have reached out to one another over the years to learn about other aspects of winter maintenance, gathering data about each other’s equipment, materials and costs. Such fact-finding efforts have typically been conducted on an ad-hoc basis, with different questions and levels of effort from year to year.
In 2015, with membership having grown to include nearly all winter-weather states, the consortium saw an opportunity to formalize data collection as a systematic multi-year activity. Justin Droste, asset management engineer for the Michigan Department of Transportation (MDOT), led the subcommittee on this project. “We set out to collect objective, clear-cut data that could be quantified and compared,” Droste said.
With input and oversight from its technical advisory committee of state representatives, Clear Roads developed an online survey to capture nearly 50 data points related to each state’s winter maintenance operations. The survey also featured several free-response questions for states to provide clarifying information and details.
The survey’s main areas of inquiry were organized under four categories: highway system, winter maintenance resources, materials and costs. (A more detailed breakdown of these categories can be found in the sidebar.) Clear Roads invited all 50 states, as well as the District of Columbia, to participate in the survey to provide information for the 2014-15 winter season. Thirty-five states answered the call.
Making it better
From the outset, the consortium’s goal was complete transparency with the findings. Public and private users alike are free to examine, analyze and parse the complete data set, which lives on the Clear Roads website, as they see fit. “Our goal was to create information for the betterment of the entire snow-and-ice community,” Droste said, “and I believe we achieved that.”
In addition to the raw data, the results include derived statistics from this year’s data set, such as the ratio of full-time workers to part-time workers and the total dry chemicals applied per lane-mile.
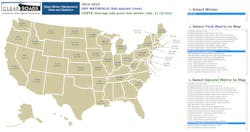
Moreover, to make the results useful to as many people as possible, Clear Roads took the extra step of developing an interactive mapping tool that graphically displays the data. By simply clicking on a menu in the results, users can display any one of 21 different metrics on an interactive map of the U.S.
Droste reported that the technical advisory committee was very satisfied with the mapping feature. “The data comes to life on the map,” he said. “It’s so much easier to spot geographical trends and see what our neighbors are doing. In addition, we had a lot of data on our hands after conducting such an extensive survey, and the map distills the volume of data into something more manageable.”
Morin added that this interactive map effectively took the place of WSDOT’s former salt map. “It includes the same information,” he said, “while adding a number of other helpful dimensions related to winter maintenance.”
The Clear Roads winter maintenance database includes a mapping feature to let users visualize data sets and identify regional trends.
For agencies and vendors alike
Clear Roads members have plans to put the findings to good use. “Because winter maintenance is such a big part of the budget in many states,” Droste said, “it is often under considerable scrutiny. We are frequently asked to explain what we’re doing and how we’re spending our budget. This tool will help us present answers in a national context.”
The database can help public agencies with procurement as well. If a maintenance department is interested in a new type of equipment, the Clear Roads survey findings can provide guidance on which states are already using it. Morin gave tow plows as an example. “I had an idea about who was heavily invested in tow plows,” he said, “but when I looked at the database, there were some surprises as well. Now I know who I can call if I have questions.”
The database likewise presents a great deal of value for the private sector. Wells saw how this study might help vendors connect with public agencies. “I can certainly envision vendors using this database to find out which states are using what types of materials or equipment,” Wells said, “and identifying where the next opportunities are.”
Droste added that researchers might find this database useful as well. “There is nothing out there as comprehensive as this tool,” he said. “Just about every research project—whether funded by Clear Roads or someone else—calls for determining the state of practice, and this tool gets you much of the way there.”
Taking the longitudinal view
Consortium members anticipate this database will only become more valuable over time.
“Right now we can look at the map or crunch the numbers and get a sense of trends over space,” Droste said. “Once we have two years of data or more, we’ll be able to start identifying trends over time.” For example, it may become evident how costs change with shifts in workforce, or how states or regions invest in new technologies or alternative chemicals over several years.
For all of the different kinds of winter maintenance included in the database, one type of data notably absent from the survey was any measure of winter weather or climatologic severity. “We set out to ask about items that are straightforward to measure and interpret,” Droste said. “That’s not easy to do for winter weather.”
Wells agreed: “Winter weather is highly variable over a large geographic region and over time. It’s a challenge to quantify.”
Droste pointed out that other coordinated national efforts, such as the Aurora pooled fund study and the Maintenance Decision Support System, are focused on defining and measuring winter severity. However, he does not rule out including some type of measure in the survey in future years. “Depending on where the state of practice goes,” Morin said, “I could see asking about a defined severity index in future editions of the survey.”
Morin noted that this gets to one of the greatest strengths of Clear Roads’ survey—flexibility. “We can consistently ask for the comparable data from year to year while rolling in new survey questions where they make sense,” he said. “I look forward to seeing how this tool develops.”
Data collection for the 2015-16 winter season is already underway, and Clear Roads has again invited all state DOTs to participate.
About The Author: Hirt is with CTC & Associates LLC.


