How cities can optimize snow removal to boost road safety and save dollars
By: Megan Ray Nichols
The winter months can take their toll on the best of us, but for mayors, city planners, and transportation system engineers, the challenge is especially intense.
How can cities throughout the country and the world take their winter weather preparedness and response to the next level? What does it take to ensure bridges and roadways get cleared of snow in a timely fashion?
The answer lies in the accumulation of useful data from a variety of sources—and even clever ways to predict equipment maintenance needs and changing circumstances on the ground.
THE UPS MODEL
Cottonwood Heights, located in Utah, provides one of the most straightforward models for how data and route optimization can improve the efficiency of a city’s snow removal response.
At its simplest, snowplow truck route optimization borrows a page from the UPS and FedEx driver’s handbook by avoiding left-hand turns. Using mapping software and operating from a central dispatch location, municipal representatives ensure drivers take the most direct route through a neighborhood the first time through. Avoiding left turns might sound like a small enough variable, but it greatly reduces the time required to traverse a driver’s route through a city, ensuring more snow gets picked up on the first pass.
Driver training is another all-important element here: Once municipalities have a set of routes planned out, cities train and retrain those drivers on the best practices required to travel them efficiently and safely, no matter the conditions.
It is not just about prior planning and driver training exercises, however. This entire process more and more closely resembles a finely tuned machine as new data types enter the mix. In the case of Cottonwood Heights and an ever-larger number of cities throughout the U.S., the collection of data begins with global positioning systems (GPS).
GPS + REAL-TIME TRACKING
The city of Boston provides an instructive look at how city leadership and municipal entities can leverage big data and digital organization tools in the fight against extreme winter weather and challenging snowfall. This city and its surrounding areas receive an annual average of 45 in. of snow—and that is a big part of why Bean Town turned to high-tech solutions to get snow cleared from roadways.
Boston is home to some 700 snowplow trucks, but until 2014, there was no convenient, centralized way to deploy them efficiently in the wake of challenging weather. That changed when the city began working with Qlarion and Esri to adapt geographic information system (GIS) technology to snow removal. The result is a platform called, appropriately enough, “SnowCOP.” Instead of deploying trucks and simply hoping for the best, SnowCOP uses GPS and mapping software to organize snow removal efforts and keep track of each vehicle in real time.
SnowCOP, or “Snow Common Operating Picture,” depends on GPS devices installed on each plow truck. These devices relay real-time location data, once per minute, back to the city’s public works office or whichever other facility serves as home base. In Boston’s case, the result is a clear, minute-by-minute picture of where each vehicle is working across Boston’s network of more than 30,000 streets.
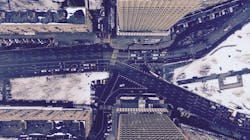
As the software accumulates and plots this location data, it assembles a map of which streets have been serviced and which have not. Streets that have already been plowed appear on the map in green, while all the rest are called out in red. On its own, this system is impressive enough and certainly handy in the struggle to keep roads safe and driveable. But it is just the beginning of the data municipalities have at their disposal.
CROWDSOURCING DATA
SnowCOP and platforms like it bring other data into the mix too—the crowdsourced variety.
In addition to populating city maps with color-coding according to plow truck activity, SnowCOP also seamlessly incorporates crowdsourced data from city residents. Specifically, citizens can dial “311” in Boston to report roads that have not yet been serviced and roads that require another pass from a plow because of accumulating snow. SnowCOP feeds this location information into the dashboard as well, which helps dispatchers make decisions about how to tweak snowplow routes and adjust their priorities up or down, depending on ongoing demand.
Municipalities previously relied on historical data to make these decisions. Bringing real-time data into the mix is a huge boon to city safety. It is also valuable for “breaking the fourth wall” between residents and local government. Boston deployed SnowCOP in 2014, and it was closely followed by an additional digital platform, called Snow Stats, in 2015. By simply inputting their address, residents can use this online system to access information about which roads in their neighborhoods have been plowed already.
This degree of accessibility and transparency is good for safety and alerting residents when roads are or are not safe to travel, whether any roads are closed, and whether the city has posted any travel restrictions. It is also great for helping residents plan alternate routes if they absolutely must venture out into the elements.
BEYOND LOCATION DATA
Boston is not the only city in the U.S. with its own public snowplow tracking portal. There are no fewer than four such websites operating in the region comprised of Washington, D.C. and select suburbs in Virginia and Maryland.
Properly optimizing a city’s response to intense snowfall requires more than just location data, though, however well publicized it may be. The Kentucky Transportation Cabinet, for example, now enjoys a wealth of data during wintertime thanks to a variety of sensors installed onboard its fleet of hundreds of plow trucks to monitor other elements in its extreme weather responsiveness, including:
- The physical condition of the roads
- Real-time temperature readings
- Whether—and how much—salt has been applied to roadways
Making this information public performs double duty: It provides insight so that city decision-makers and fleet managers can make timely and relevant decisions in the wake of extreme or even routine winter weather. It also informs the public about the conditions and the ongoing storm response efforts in their area, which helps cut down on unnecessary 311 calls and keeps the phone lines open for more serious emergencies.
But what if even this wealth of data is not enough? For everything else, there is predictive analytics, a relatively new but certainly promising addition to high-tech snow removal optimization.
PREDICTING NEEDS
In Iowa, leveraging historical data can provide insight into the future.
The age and condition of snowplow trucks are easily overlooked variables in any city’s winter weather or emergency response preparedness. Iowa State researchers concluded that by turning to a decade’s worth of city data, they could help the Iowa DOT save up to $5 million annually on the cost of maintaining its fleet of trucks. This assistance is important for maximizing state budgets as well as ensuring that vital pieces of equipment get replaced in time for periods of heavy snowfall.
The researchers concluded that the “sweet spot” for maximizing snowplow truck availability—along with the budget that sustains this availability—sits somewhere between six and seven years of use. It is an important consideration when not every kind of snow removal vehicle is created equal with the same price tag. Snow removal vehicles equipped with tracks are usually more expensive to service and replace, but they are also more useful in areas that see intense snowfall during the winter months. Researchers leveraged historical maintenance data and even pulled in current information, such as estimates for resale value.
There is a great deal of potential for cities that choose the predictive model for addressing snow removal. Another proof of concept comes from the University of Maryland. Paul Torrens leads a team of researchers who have dedicated themselves to better understanding the manifold “in the moment” decisions made during weather events by the general public. These decisions include the portion of the public with access to the Internet and telecommuting opportunities, the availability of ride-sharing services, sentiments shared on social media, and how citizens interact with critical public infrastructure, including roads and bridges.
Feeding all of this information into a predictive model helps city planners redress shortcomings in public services and determine whether public structures can properly accommodate moment-by-moment traffic adjustments and the many other demands placed on them by extreme weather.
DISPOSAL DECISIONS
GIS-based mapping technologies, not to mention real-time data on truck locations, do not just help city planners optimize snowplow truck routes. They also are a big help in deciding how and where to dispose of snow as it is taken off city streets.
For a start, it cannot just be dumped into a nearby waterway. Snow removed from public roads contains chemicals, salts, and oils that do not belong in rivers and streams. So, to avoid worries over public health, cities rely on carefully chosen locations for city trucks to deposit snow once plows have taken it away from our roads.
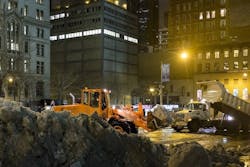
Public spaces such as parking lots are one such location. These areas sometimes go by the name “snow farms,” and they often take the form of mounds of snow, which can last well into the warmer months of spring and even later.
Cities monitor these locations and assign them to drivers for an efficient snowfall removal process. Boston and other cities where real estate is limited sometimes deploy heavy-duty, diesel-powered snow-melting equipment. These options are expensive but effective. During peak snowfall season, Boston officials boast a snowmelt rate of up to 400 tons per hour at designated “snow farm” sites.
Managing snowfall effectively and getting it cleared from city centers efficiently is a very old problem. Thankfully, big data, location tracking tools, and predictive analytics can help cities tackle the challenge and keep major transportation and commerce centers humming along even during terribly inconvenient and extreme weather.
About The Author: Nichols writes about manufacturing, supply chain, and infrastructure topics and maintains the blog Schooled By Science.
