Impacts of connected and automated vehicles on I-270 in Maryland
There is a transformation taking place in the transportation industry with regard to safety, mobility and the environment, similar to what happened at the turn of the last century with the invention of the automobile. The impacts of connected and automated vehicles (CAVs) as well as commensurate changes to mobility and demand will be significant, and it is critical to be able to quantify and evaluate these impacts so that we can plan for the future of transportation infrastructure in a more sustainable way.
Connected and automated vehicle technology is proliferating, and this trend is only expected to continue in the coming years. Vehicles that can partially or completely drive on their own are becoming a reality. Automated vehicles use information from radar, laser light, GPS, odometry and computer vision to detect their surroundings. Advanced control systems interpret sensory data to identify appropriate navigation paths, as well as obstacles and relevant signage. Connected vehicles communicate and share vital transportation information to other vehicles, roads, and other infrastructure, including our smartphones. Deployment of this technology is expected to result in substantial benefits in safety, mobility, accessibility, operational efficiency and quality of life. State and local agencies are increasingly interested in pre-deployment planning to not only be better prepared but also to be efficient in investing in future infrastructure projects.
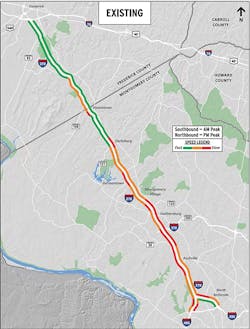
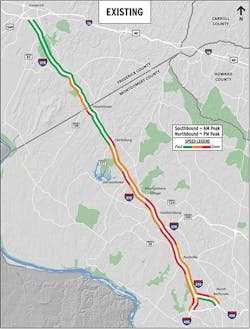
The I-270 corridor in Maryland is a primary commuter route and one of the most congested and unreliable corridors in the country. There is a high-occupancy vehicle (HOV)-only lane in both directions that is operational during peak periods. However, the demand in the corridor is much higher than the capacity available along I-270, and the HOV lane is not sufficient to manage the demand. Figure 1 shows the congestion levels under existing conditions for the entire I-270 corridor in the northbound and southbound direction.
Previous research conducted for the Transform 66 Outside the Beltway project utilizing the capabilities within VISSIM traffic microsimulation software to simulate and analyze the impacts of CAVs showed that with higher proportions of CAVs along the corridor, there is potential for significant reduction in congestion (Figure 2). However, 100% fleet conversion to CAVs cannot be expected to happen for the foreseeable future, and the maximum benefits to roadway capacity can only be achieved when the entire vehicle fleet has made the conversion. But providing dedicated CAV lane(s) can work as an interim solution. This study was the next step in a line of research that was conducted to evaluate the impacts of different levels of CAVs mixed into existing lanes. Similar to HOV lanes, this study looked at providing a limited-access managed lane along the I-270 corridor for the exclusive use of a CAV fleet and evaluate its impacts on mobility in the corridor.
Figure 1. The congestion levels under existing conditions for the entire I-270 corridor in the northbound and southbound direction.
Methodology
It is important to be able to accurately quantify the impacts of CAV applications. This can only be done if the tools available are capable of conducting an accurate assessment. Most of the analysis, modeling and simulation tools that are being used to do CAV analysis today were not built for this purpose. Many of these tools have been upgraded or updated to enable them to do some planning level analysis for CAV application.
For this study, an innovative analysis process was developed. Calibrated VISSIM microsimulation models which replicated real-world conditions for the 32-mile corridor along I-270 were used to conduct the analysis. The morning peak period traffic conditions were analyzed where the I-270 southbound direction is the peak direction of travel. The microsimulation models were developed and calibrated by the Maryland State Highway Administration as part of the I-270 Innovative Congestion Management project. These models were modified to develop the proposed scenario and to conduct the analysis.
The driver behavior parameters in VISSIM were modified for CAV vehicles to more closely represent how an automated vehicle would drive. The challenge was that currently all manufacturers of this technology are working independently, and there are no standards for decision making for an automated vehicle. PTV, the developers of the VISSIM software, provided recommendations on the driver behavior parameters to be used, based on their independent research on CAV modeling. These modified driver behavior parameters assume that the CAV has at least a Level 3 self-driving capability on the Society of Automotive Engineers’ Levels of Driving Automation. Under limited conditions, these vehicles can fully operate autonomously with almost no human input required. It is expected that under these conditions, the CAV vehicles will drive closer to each other, thus increasing capacity of the existing roadways. They can communicate with vehicles upstream and downstream, thus harmonizing speeds along the corridor. The continuous machine monitoring of the CAV will allow for faster reaction times and better decision-making for car-following and lane-changing. This results in an increase in capacity and better flow of traffic in the CAV-only travel lane compared to the other general-purpose lanes.
A base scenario with existing conditions was evaluated along with three additional scenarios with a CAV-only lane and varying levels of CAV proportions in the fleet along the corridor. The overall vehicular demand was kept consistent between the different scenarios. Detailed speed congestion diagrams, corridor travel time and throughput along the corridor were compared as measures of effectiveness to evaluate the impacts.
Apart from these benefits, there are other potential benefits that have not been evaluated such as safety and environmental benefits due to the reduction in non-recurring congestion and crashes.
Figure 2. Previous research showed that with more CAVs along the corridor, there is potential for significant reduction in congestion.
Findings
The findings of the study helped explain the impact of a CAV fleet on the capacity of the corridor. There is a direct correlation between the proportion of CAVs in the fleet and the increase in capacity in the corridor.
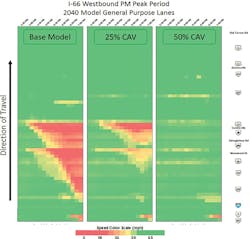
The speed congestion diagram as shown in Figure 3, which is essentially a time-space diagram showing how the queues develop and dissipate along the corridor over a specific period of time, showed that under the base conditions with the HOV-only lane, there is significant congestion in the corridor. With the CAV-only lane and just 15% of the vehicles being CAVs, at least one upstream bottleneck is eliminated. With an increasing proportion of CAVs in the fleet, the benefits along the corridor tend to scale down as the CAV-only lane reaches its capacity and can no longer accommodate additional vehicles.
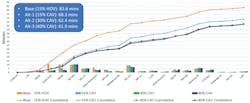
Looking at travel times along the corridor also shows the same trend. As seen in Figure 4, there is a big reduction in travel times for up to a 30% proportion of CAVs, but beyond that more CAVs do not help reduce corridor travel times. The travel times are an average of all vehicles in the corridor. There is a more than 25% reduction in travel times with the CAV-only lane and 30% proportion of CAVs in the fleet.
Considering an upstream bottleneck being eliminated, the increase in throughput could make the downstream bottleneck worse. However, in this case even with the elimination of an upstream bottleneck, the downstream bottlenecks reduce or remain the same with an overall increase in throughput along the corridor with the CAV-only scenarios. So even with the increase in throughput upstream, there are speed and travel-time improvements.
Figure 3 (top)—A speed diagram shows significant congestion in the corridor.
Challenges and opportunities
There were some challenges while conducting this study due to the real-life corridor conditions and existing geometric constraints while conceptualizing a CAV-only lane. Under the constraints the CAV-only lane was not assumed to be a barrier-separated facility. Providing a dedicated barrier-separated CAV-only lane could result in greater benefits for the corridor.
It is important to understand that every corridor is unique with respect to the traffic and the geometric constraints. As such, the benefits evaluated from one corridor may not necessarily be the same in magnitude when applied to a different corridor or facility. For a capacity analysis study like this done using microsimulation modeling, the overall trends of the findings may be similar, but the proportion of improvements may vary depending on the conditions of the corridor.
Overall, the study concluded that a CAV-only lane provides a greater return on investment by supplementing an existing travel lane or shoulder lane with a high-capacity, reduced-width dedicated CAV lane. It also opens the door to conceptualize similar dedicated CAV lanes in other parts of the country while providing a safe facility where CAVs can take maximum advantage of their technology.
Figure 4 (above)—There is a big reduction in travel times for up to a 30% proportion of CAVs.


