How the texture of a pavement surface contributes to the tire-pavement friction
By: Hossein Roshani, Ph.D., P.E. and Sareh Kouchaki, Ph.D., P.E.
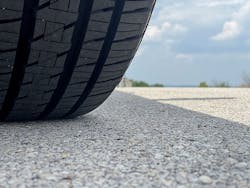
Proper tire-pavement interaction is essential for the safety of motorists. Pavement surface texture is a major contributing factor to tire–pavement friction. Understanding the texture-friction relationship is valuable for transportation agencies, engineers, and contractors for proper pavement design and maintenance, especially when higher skid resistance is needed.
The direct force developed in the tire-pavement interface is known as skid resistance, a parameter defined by the properties of the tire, the vehicle speed, and the pavement condition and texture. The extent of skid resistance on any given pavement depends on the design of the surface texture, specifically its micro- and macro-texture. The surface texture can affect the skid resistance, splash-and-spray, rolling resistance, and tire wear. Pavement design can adjust surface pavement properties to provide the safety needed.
What is pavement texture?
Pavement surface texture is influenced by many factors, such as aggregate type and size, mixture gradation, and texture orientation, among others. Pavement texture is the result of the deviations of the surface layer from an actual planar surface. The World Road Association has categorized pavement texture by a range of wavelength (λ) and amplitude (A). The standard specification organizations, such as the American Society for Testing Materials (ASTM) and International Organization for Standardization, accepted and incorporated these definitions.
- Micro-texture (λ < 0.5 mm, A = 1 to 500 µm) (where λ is wavelength and A is amplitude)
- Macro-texture (0.5 mm < λ < 50 mm, A = 0.1 to 20 mm)
- Mega-texture (50 mm < λ < 500 mm, A = 0.1 to 50 mm)
Micro-texture refers to the small-scale texture of the aggregate surface, which controls the contact between the tire rubber and the pavement surface. Micro-texture is a function of aggregate particle mineralogy, petrology, and source (natural or manufactured), and is affected by the environment and traffic. Macro-texture refers to the large-scale texture of the pavement surface due to the aggregate particle size and arrangement. In asphalt pavements, the mixture properties (aggregate shape, size, and gradation) control the macro-texture. Mega-texture has wavelengths in the same order of size as the tire/pavement interface. Examples of mega-texture include ruts, potholes, and major joints and cracks. It affects vibration in the tire walls but not the vehicle suspension, and it is therefore strongly associated with noise and rolling resistance.
Pavement friction is the result of a complex interplay between two principal frictional force components: adhesion and hysteresis. Adhesion is the friction that results from the small-scale bonding/interlocking of the vehicle tire rubber and the pavement surface. It is a function of the interface shear strength and contact area. The hysteresis component of the frictional forces results from the energy loss created within the tire as it responds to the texture. Because the adhesion force is developed at the tire/pavement interface, it is most responsive to the micro-level asperities (micro-texture) of the aggregate particles. In contrast, the hysteresis force developed within the tire is most responsive to the macro-level asperities (macro-texture) formed in the pavement surface. Thus, in principle, adhesion governs the overall friction on smooth-textured and dry pavements, while hysteresis is the dominant component on wet and rough-textured pavements.
Measurement of Skid Resistance
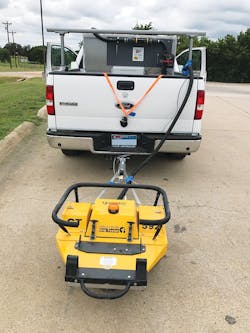
To study the pavement texture-friction relationship, a few years ago, researchers at the University of Texas at Austin selected the Grip-Tester as a skid resistance measuring tool, because it showed the most promise for measuring pavement friction. It has a wider range of test speed, better repeatability and reproducibility (depending on the operating speed), greater efficiency in water usage, and commercial availability. The Grip-Tester is a friction-measuring trailer that uses a fixed slip wheel to simulate anti-lock braking on a wet road surface.
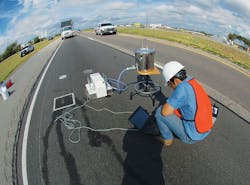
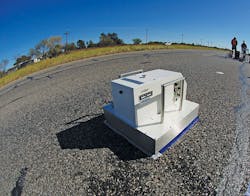
Along with the Grip-Tester, the Dynamic Friction Tester (DFT) was used to measure the friction of the pavement at different speeds. The DFT consists of a rotating disk and three rubber pads attached to the bottom of the disk. The disk is pushed by an electric motor to rotate until it reaches the target speed set by an operator. The DFT measures the friction coefficient continuously until the disk stops completely.
Measurement of pavement surface texture
CTM is a common static method used to measure the macro-texture of the pavement surface. According to the ASTM, the CTM consists of a laser-displacement sensor that rotates over a circle with a diameter of 11.2 in. (284.5 mm) and measures the profile of pavement surface texture. The profile includes 1,024 points scanned at an interval of 0.034 in. (0.87 mm). Using the instructions provided by ASTM, the measured profile then is sectioned into eight equal parts and the highest profile peak in each part is measured.
Field-data collection
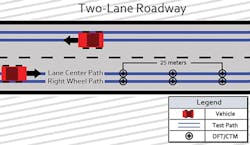
Three test sections, each more than five years old, were selected. Each section had established measurement data for the DFT and CTM. The sections were chosen to provide a variety of mix designs, ensuring variation of surface texture for the test. The test sections are in three different counties in the state of Texas.
At each location, six samples were taken: three in the right wheel path and three in the center of the lane, with a 41-ft (12.5 m) distance between the locations. Within each location, two measurements (one CTM and one DFT), were obtained.
For the Grip-Tester, two target speeds—31 mph (50 kph) and 43 mph (70 kph)—were tested to evaluate the dependency of speed on friction. The speed had to be maintained within 5% of the target speed. The 43-mph target was selected to enable a direct comparison to the DFT equipment, which has a speed range of up to about 50 mph.
Grip-Tester Results
The Grip Number (GN) of all test locations were plotted against the DFT values at two different speeds of 31 and 43 mph (50 and 70 kph). Results showed that the GN values have a strong relationship with DFT values, with R-squared (the coefficient of determination) values of 0.93 and 0.91 at the two different speeds. R-squared values range from 0 to 1 representing the highest and the lowest variance, respectively. It can be concluded that this relationship is independent of the test speed.
These findings indicate that the Grip-Tester is a reliable alternative for the DFT and does not require traffic control; therefore, it is safer and more efficient. Besides, the Grip-Tester enables engineers to obtain continuous friction data over a long pavement section.
Relationship between Texture and Friction
The GN and DFT values both represent the friction properties of the pavement surface; however, the values obtained by the CTM reflect the texture characteristics of the surface. To explore the relationship between the friction and texture, those two groups were plotted against each other in two different forms: GN vs. CTM and DFT vs. CTM.
Using statistical analysis, the correlation coefficient (R) was used to evaluate the relationships. The R ranges from -1 to +1, where negative and positive signs represent the negative or positive linear correlation, respectively.
The statistical analysis showed that the relationship between the GN values and CTM results is strongly linear with high correlation coefficients. For the Grip-Tester performed at 31 mph (50 kph), a R value of 0.83 was found for GN-CTM. In addition, higher correlation coefficients were observed at 43 mph (70 kph). The R value of 0.88 showed a strong linear relationship between GN as a friction parameter and texture parameter of CTM.
From the results obtained, the Grip-Tester data have a better relationship with texture compared to the DFT data in terms of the calculated R-squared values. Thus, it can be suggested that friction and skid resistance could be estimated by means of texture measurement data with high confidence.
Conclusion
This study investigated the relationship between the texture and friction of pavement surfaces using field-measured data. During this study, CTM was used to measure the texture data. DFT and Grip-Tester were employed for friction measurement.
Regardless of the test speed and pavement type, the friction number obtained by the Grip-Tester showed a strong linear correlation with DFT measurements. Due to the reliable results of the Grip-Tester, its wider range of friction measurement, and the lack of need to control traffic, this device is recommended for use by state DOTs for friction measurement. The quality of the friction data obtained by a Grip-Tester seems to be somewhat sensitive to the test speed, because the GN decreased slightly when the test speed increased from 31 mph to 43 mph. This finding implies that keeping the test speed fixed at different test sections is important to achieve comparable results.
This study’s statistical analysis findings pointed to a strong positive linear correlation between texture and friction in pavements. The highest linear correlation coefficients (R) were observed between the GNs obtained at 43 mph (70 kph) and texture data obtained using the CTM. The authors of this study recommend running the Grip-Tester at higher speeds in cases when the texture-friction relationship analysis is the point of interest. As a further recommendation, accurate friction prediction models could be developed based on the texture measurement data to eliminate the need for direct friction measurement.
About The Author: Dr. Roshani is a project manager at Lockwood, Andrews & Newnam Inc. (LAN). Dr. Kouchaki is an engineer at City of Austin’s Public Works Department.
