WEB EXCLUSIVE: Mapping urban infrastructure
Connected vehicles have captured the public’s imagination. A multitude of new announcements from big automotive, technology companies and the U.S. DOT, coupled with the potential to greatly improve the safety and efficiency of surface transportation systems, has even public agencies evaluating the idea of connected vehicles, especially as they provide valuable information for agencies for operational purposes such as:
- Speed information, wait times, including acceleration and deceleration near intersections;
- Hyper local weather information;
- Crowd-sourced pavement conditions;
- Traffic information about incidents; and
- Traffic signal timing data which can promote safe and eco driving
In the connected vehicles arena, the vehicle onboard units (OBUs) exchange real-time information with the infrastructure through the roadside unit (RSU) typically using a Dedicated Short Range Communication Radio (DSRC) for navigational and automated operations.
Why the project started
The original intention of the project was to prepare the District of Columbia for the rapidly approaching age of autonomous driving as many cities are working towards installing the infrastructure required to enable a smooth transition to incorporating connected vehicles into the transportation network.
One of the areas identified as needing investment is generation of Message Access Profile (MAP) messages for intersections in urban areas. The project goal was to explore the possibility of collecting inventory of all pavement marking and curb locations, with high precision in an automated way. The Washington, D.C. Department of Transportation (DDOT) recently procured street-level LiDAR and street-view data, which provides rich attribute data with six dimensions as discussed below.
What is LiDAR data?
Light Detection and Ranging (LiDAR) is a survey method that uses light in form of pulsed laser to measure variable distance in a scenario. LiDAR can be categorized into two classes: airborne LiDAR (ALS) which emits infrared laser light from a fixed-wing aircraft; and terrestrial LiDAR (TLS). The dominant type of LiDAR technology utilized in the studies of urban planning and geomorphology is TLS. The terrestrial LiDAR techniques, usually mounted on moving vehicles, provide much more accurate point collection procedures and can be used to manage facilities, conduct highway and rail surveys.
Although airborne LiDAR techniques cover a wide geographic range in certain regions, they fail to collect dense point clouds with high accuracies due to several constraints. The terrestrial LiDAR technique can facilitate rapid dense collection of geographic information. In recent years, several applications—especially autonomous driving—exploited the feasibility of using terrestrial LiDAR data in the identification of objects, and road boundaries.
The street-level LiDAR data procured by DDOT was provided by a third-party provider, Cyclomedia, Inc., and covers 200+ lane miles in Washington, D.C. The LiDAR data is overlaid with street view imagery providing uniquely rich data reflecting real-world attributes such as position and color.
We used deep learning neural network algorithm called Autoencoder to recognize the pavement markings and lane information. Autoencoder is an unsupervised machine-learning algorithm that is capable of extracting hidden features of given high-dimension data. It is constructed under the scheme of the feedforward non-recurrent neural networks. It consists of an input layer, multiple hidden layers and one output layer.
The work can be divided into three parts:
Step 1: Pre-processing of LiDAR cloud and images
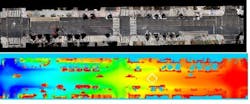
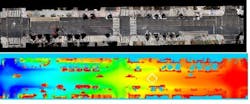
Street-level LiDAR data provides rich information about the streetscape, but also accumulates Gigabytes of data in just a few blocks. Efficient preprocessing is the key to effective use of the data. For this work, pavement-level data is needed without extraneous information, so the first challenge is the significant variance of elevations along roadway corridors due to accommodation of various infrastructure requirements such as drainage and American Disability Act (ADA) safety requirements. Figure 2 shows a heat map of an elevation of a typical corridor in Washington, D.C., ranging from the lowest elevation shown in blue and increasing to the highest shown in red. To address this issue, corridors are cut in regular intervals, depending on gradient to generate ground-level data.
Figure 2: Typical Elevation of Street Profile
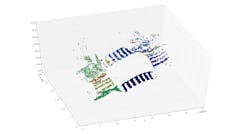
Also, depending on the angle of the equipment, shadows and the presence of other obstacles such as vehicles may cause the quality of LiDAR cloud-point data to vary at ground level. This fact is the main focus of our research. Figure 3 below shows LiDAR data at an intersection with spare points on one side.
Step 2: Clustering the data and image generation
In this step, data points are clustered using a distance-based clustering method. It was expected that color aggregation would easily separate pavement markings from the background, but in reality a huge spectrum of colors was found. Color spectrum occurs because of variables such as shadows, bright sunshine and deterioration of infrastructure. This phenomenon is referred to as Checker Shadow Illusion. In order to distinguish the pavement marks from the pavement background, a distance-based two-clustering algorithm is used. Due to the extremely large size of the target LiDAR point clouds data set, it is not computationally efficient for the clustering algorithm to consider the entire data set as the input. To increase the efficiency, the Random Sample Consensus (RANSAC) paradigm is utilized with 10% sample rate of the original files.
K-mean clustering algorithm
The k-mean clustering algorithm is used on the cloud point with RGB. K-mean clustering algorithm partitions the observations of the data points into k clusters, in which each point belongs to the cluster with the closest mean point. In the color-based clustering scenarios, the data points (pixels) are transformed to the RGB color space, represented by vectors comprised of red, green and blue channels of the given pixels. More specifically, given a set of LiDAR points (pixels), each observation is a pixel of a 3-D vector in RGB color space. The k-means clustering algorithm partitions the observations into sets with the goal of minimizing the sum of squares within clusters.
Upon clustering the points, a density-based spatial clustering algorithm is performed on selected points to pinpoint the location and visualize the boundaries of the pavement marks.
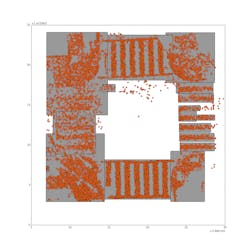
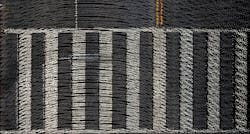
Figure 3 shows clustering of LiDAR data based on the coloring scheme. Figure 4 shows the clusters in two dimensions. The clusters then convert to images as shown in Figure 5. These images will be used for the deep learning algorithms described in Step 3 to differentiate pavement marking from noise like curbs, cars and other infrastructure.
Figure 3. Spatial Clustering of LiDAR Data point data
Figure 4. 2-D clustering of data generated from 3
Figure 5. Images generated from spatially clustered images
Step 3: Classification and plotting of generated data using deep learning techniques
Autoencoder is a deep learning technique known for its promising performance in extracting and identifying features in high-dimensional spatial data. The training data contains 128 road sections in Washington, D.C., with an overall size of 18.1 GB. The 16th Street, NW corridor—between T Street NW and Church Street NW—was selected for testing the developed model. A total of 900 top-view images of various intersections were used for training the Autoencoder model. Four intersections were selected for testing data generation, including a total of 132 labelled data.
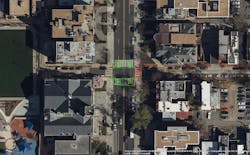
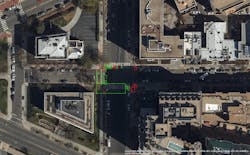
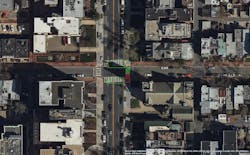
The model has achieved an accuracy of 71.2% in classifying the data to the correct category as shown plotted on the map shown in Figure 8(a). The green boundary boxes represent the pavement markings predicted by algorithm and the red boxes show noise recognized by the model on 16 Street NW between N Street and T Street NW. Figure 6-8 shows individual intersections.
Figure 6: Detected pavement marking on 16th St and Church St NW
Figure 7: Detected pavement marking on 15th and N St NW
Figure 8: Detected pavement marking on 16th and Corcoran St NW
Conclusion and future work
The research is pioneering work in the use of street-level LiDAR data. As we continue working on algorithms and procure more data, accuracy will improve. Future work will concentrate on developing algorithms to generate missing LiDAR data, which will improve accuracy. As the data quality improves the algorithm can be used to detect items such as
a. Roadway assets
b. Roadway symbols such as arrow symbols, bike crossings
c. Quality of the pavement markings
d. Curb detection and construction
e. Generating MAP messages
---------------
The author would like to acknowledge the support received from District Department of Transportation (DDOT) for implementing the project, especially from ITS Department and IT department.
