Nebraska DOT launches traffic count dashboard
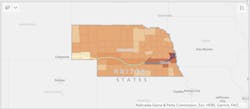
This week, the Nebraska DOT (NDOT) launched a new traffic count dashboard as an informational resource for state residents.
NDOT has been reporting traffic data since March 1 to track the impact of COVID-19 on statewide traffic volumes. For the week of April 12 through April 18, statewide traffic volumes were down 35% compared to the 2016-2018 average.
“The traffic count dashboard is a tool to help the DOT understand and communicate how COVID-19 is impacting travel in Nebraska,” NDOT Director Kyle Schneweis said in a statement. “While we are seeing freight traffic stay at near normal levels, a 35% decrease in statewide traffic volume poses potential impacts to how the NDOT does business. It is too early to estimate the extent of impact but we’ll continue to analyze the data to understand scenarios.”
The data compares 2020’s traffic to the historical three year (2016-18) average daily traffic for each day of the week for that month and then averages the difference in traffic for each week by category. Data for 2019 was excluded due to the impacts of flooding on highways. For example, March 15-21 is calculated by finding the difference in March 15, 2020 vs. the historical average Sunday traffic for March; March 16, 2020 vs. the historic average Monday in March, etc. Then each day is averaged together to get a weekly average change in traffic.
NDOT maintains a system of 67 continuous traffic counters statewide. These are often called automatic traffic recorders (ATRs). These counters collect traffic volume and classification data 24 hours per day, seven days per week. Data is then relayed to NDOT twice per week.
-------
SOURCE: Nebraska DOT
