Filling the gap
Intersections are focal points for both safety and efficiency.
On one hand, intersections are flashpoints for traffic accidents. On the other hand, they also are hot spots for traffic congestion, causing substantial delays and driving frustration.
For signalized intersections, it has been a challenging problem regarding how to improve traffic safety while ensuring operational efficiency, particularly during nighttime. About 49% of fatal crashes happen during nighttime, resulting in a fatality rate three times higher than that during daytime. For these nighttime crashes, one of the main contributing factors is vehicle speed, causing 37% of accidents. While the need to enforce traffic control that could reduce vehicle speeding for arterials is evident, operating traffic signals with such consideration remains a difficult task for traffic management agencies.
Existing nighttime signal practice often adopts flashing operations, either red/red or yellow/red flashing. The red/red flashing operation essentially works as an all-way stop sign, forcing all vehicles to come to a complete stop at intersections. It is usually employed if traffic volumes on all approaches are equivalent and relatively small.
While this operation is effective for speed calming, the drawback of the operation is that it causes large delays. The yellow/red flashing operation essentially works as a caution sign for major approaches and stop signs for minor approaches. It is commonly used when a major approach has a significantly larger volume than a minor approach. While this type of operation considerably reduces delay on major approaches compared to red/red operation, it raises substantial safety concerns due to relatively large accident rates. This is partially due to the fact that a certain percentage of people do not fully understand how flashing operations work.
Due to rising safety concerns, flashing operations are being replaced by regular signal operation. A number of before-and-after studies have shown that regular traffic operation is effective in reducing crash rates over flashing operations.
Currently, the design of signal timing mostly focuses on improving efficiency, including capacity management, or signal coordination. However, current tools for the design of nighttime traffic signals still lack the consideration of traffic safety. In this regard, there remains a gap.
How does SAFEBAND work?
SAFEBAND is mathematically built upon the classic MAXBAND formulation, which was proposed by Prof. John Little from the Massachusetts Institute of Technology in 1981. Where it differs is that SAFEBAND focuses on reducing vehicle speed, while ensuring that vehicles do not encounter exaggerated delays or stops.
SAFEBAND is formulated as a mixed integer linear programming (MILP) problem. The decision variables are phase sequences and offsets at each intersection. Phase sequence refers to the order of a series of signal phases; for example, whether left-turn traffic goes first or through traffic goes first. Offset refers to the time relationship between the start of a signal cycle and the master clock. The objective of SAFEBAND is to penalize speeding vehicles, such that they would have higher probabilities of encountering red lights at downstream intersections. The traditional objective (maximizing bandwidth) from MAXBAND is moved to the constraint part to ensure an acceptable level of efficiency. This means that efficiency is not the goal of SAFEBAND anymore. Rather, it only ensures a certain lower bound for efficient signal operation. Other constraints of the system make sure that the basic setups for traffic signals are satisfied. The output is an optimal signal timing plan for the whole arterial.
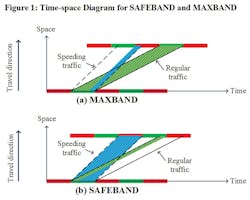
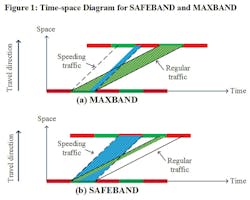
The mathematical description of SAFEBAND may sound abstract. The idea is best illustrated in the time-space diagram in Figure 1, which plots the location of signalized intersections along the vertical axis and the signal timing along the horizontal axis. It is a visualization tool that illustrates signal coordination relationships between intersections. Time-space diagrams are widely used by traffic engineers for optimizing traffic signals.
The area between the two solid lines denotes regular traffic traveling at the speed limit. The area between the two dashed lines denotes traffic exceeding the speed limit. The classic MAXBAND aims at maximizing bandwidth, i.e., the green area. The bandwidth is directly related to efficiency, as vehicles that travel in the green area (the so-called greenwave) would not encounter red lights. Therefore, these vehicles would experience less delay. SAFEBAND aims at maximizing the safety index, i.e., the blue area. The safety index is defined as the probability that speeding vehicles encounter red signals at downstream intersections.
In Figure 1(a), MAXBAND achieves maximum bandwidth. However, a considerable amount of speeding vehicles could pass through downstream intersections without a stop. This is due to the fact that those speeding vehicles could catch up to the green light at the previous cycle. This phenomena could be quite common during nighttime when cycle length is typically shorter. This indicates that MAXBAND cannot prevent speeding effectively. On the contrary, in Figure 1(b), SAFEBAND stops those speeding vehicles. As a trade-off, efficiency is clearly sacrificed since the bandwidth in SAFEBAND is much smaller than that in MAXBAND.
Trying it out
The Michigan Traffic Laboratory (MTL) conducted a study to demonstrate the effectiveness of SAFEBAND at four intersections in Ann Arbor. The chosen intersections lay at Murfin Avenue, Traverwood Drive, Nixon Road and Huron Parkway, respectively, at Plymouth Road.
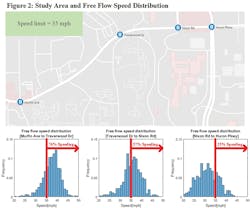
The MTL collected speed data from the Safety Pilot Model Deployment, the world’s first connected vehicle test program led by the University of Michigan. The data were collected during nighttime—10 p.m. to 4 a.m. The data revealed that speeding was not uncommon on this arterial. Although the speed limit was 35 mph, more than half of drivers chose to travel above the speed limit during the overnight period. On the road section between Murfin Avenue and Traverwood Drive, 76% of drivers were speeding. The speed histogram in Figure 2 encouraged researchers to pilot SAFEBAND on this corridor.
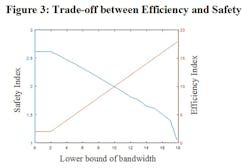
Based on the collected data, the MTL solved the MILP problem of SAFEBAND. By iterating different values for the lower bound of bandwidth in the constraint, the safety and efficiency indices can be calculated. The general trend is that, as the efficiency index increases, the safety index decreases. This once more demonstrates that there is a trade-off between efficiency and safety (Figure 3).
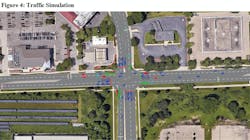
The MTL further tested SAFEBAND on the same arterial through the use of VISSIM, a commercial microscopic traffic simulator. Driving behaviors were carefully calibrated based on the data from the Safety Pilot Model Deployment. Three scenarios were tested in the simulation environment. Each scenario corresponded to a different signal setting. Scenario 1 valued safety most. Its signal-timing plan was generated from SAFEBAND. Scenario 2 valued efficiency most. Its signal-timing plan was generated from MAXBAND. Finally, a traditional red/red flashing mode was tested in Scenario 3. Three experiments were conducted independently based on these setups. The corresponding simulation results are shown in Table 1.
Scenario 3 serves as the baseline in the comparison. In this scenario, all vehicles are forced to stop at each intersection. Thus, the average number of stops during a given trip is the highest. The average percentage of speeding during a trip is 27.3%, which is due to the fact that speeding vehicles are always intervened by the flashing red lights at intersections. Scenario 2 achieves the maximum possible bandwidth. As expected, the average number of stops is the lowest. However, vehicles are still able to travel at a speed over the posted limit, which results in a speeding percentage of 31.8%. In Scenario 1, safety is explicitly considered in generating the signal-timing plan. The average percentage of speeding (27.5%) is lower than that in Scenario 3 (31.8%), and is very close to the value in Scenario 1 (27.3%).
Notice that the driving behaviors are the same in the three experiments. In Scenario 1, speeding vehicles have a higher probability of hitting red lights. Thus, those vehicles are more likely to decelerate and stop at intersections. This mechanism reduces the percentage of speeding during their trips. The average number of stops in Scenario 1 is higher than Scenario 2, but substantially less than Scenario 3. This shows that SAFEBAND is very effective in terms of speed calming, while still able to keep the average number of stops at a low level.
Research that focuses on nighttime traffic signal operation with special considerations for safety is a crucial area of overall road safety research. Actively working on resolving safety issues and developing safer and more efficient transportation systems makes work like SAFEBAND a worthy addition to the purpose of our industry, which is to save lives.
-----------
About the author:
Huang is a Ph.D. candidate in the Department of Civil and Environmental Engineering (CEE) at the University of Michigan. Shen is a research engineer at the University of Michigan Transportation Research Institute. Zhen is a senior algorithm engineer at Didi Chuxing. Liu is a professor at the University of Michigan, a research professor at the University of Michigan Transportation Research Institute, and director of the Center for Connected and Automated Transportation and the Michigan Traffic Laboratory.
