By: Zhong Wu, Ph.D., P.E., and Tyson Rupnow, Ph.D., P.E.
As a durable, economical and low-maintenance concrete material, roller-compacted concrete (RCC) is steadily becoming the choice for many pavement applications. And researchers in Louisiana are testing just how thin those applications can go.
Traditionally, RCC pavements have been built with an 8- to 12-in. slab thickness and (because of its relatively coarse surface) used for pavements carrying heavy loads in low-speed areas, such as warehouses, truck terminals, distribution centers and other industrial pavements. But now, a group of Louisiana researchers are exploring even thinner slab thickness options (4-8 in.), hoping to provide cost-effective pavement design alternatives for low-volume roadways where these type of heavy loads are encountered.
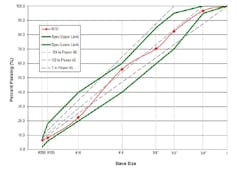
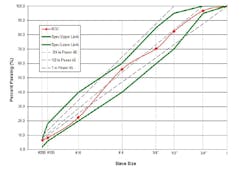
Figure 1. The final gradation recommended in PRF pavement lane construction.
Low maintenance for the low volume?
In recent years, the Louisiana Department of Transportation and Development (DOTD) has seen a rapid pavement serviceability decline on rural, low-volume roadways due to the increasing use of ports, intermodal facilities, shale gas exploration, agricultural activities and logging activities in the state. A low-volume pavement structure in Louisiana typically consists of a thin asphalt concrete over a cement-treated/stabilized soil base. Due to an increase in heavy and/or overloaded truck trafficking, those low-volume asphalt-surfaced roadways require frequent maintenance and deteriorate rapidly as a load-induced, fatigue-damaged pavement.
However, because of the proven outstanding load-carrying capacity and low-maintenance features of RCC pavements, DOTD requested a research study from the Louisiana Transportation Research Center (LTRC) to determine how thinner applications of RCC would withstand the wear and tear such heavy loads typically bring.
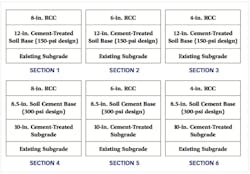
Figure 2. Six test sections designed at the Pavement Research Facility.
Running some test lanes
Spearheaded by LTRC’s Dr. Zhong Wu and Dr. Tyson Rupnow, researchers launched a study titled, “Performance of Thin RCC Pavements Under Accelerated Loading.” By utilizing the Pavement Research Facility (PRF) located in Port Allen, La., researchers hoped to create an appropriate RCC mixture proportion for constructing the test lanes (including density and strength characteristics) and then evaluate it in real time with various load-carrying capacities. Through the PRF test, researchers sought to determine the structural performance with failure mechanism and the load-carrying capacity of thin RCC pavements that may be used as a design option for low-volume pavement design in Louisiana.
Low-volume asphalt-surfaced roadways require frequent maintenance and deteriorate rapidly as a load-induced, fatigue-damaged pavement.
Mixture materials
The materials used for the RCC mix design included a Type I portland cement, a No. 67 crushed limestone and a No. 89 crushed limestone manufactured sand. Concrete samples were produced in laboratory conditions from four different cement contents to show the effect of differing cement contents on the moisture density and strength relationships. Compressive strength specimens were produced at the maximum densities for each corresponding mixture and tested at seven and 28 days of age. The final gradation recommended in the PRF pavement lanes construction is presented in Figure 1. Note that the recommended RCC mix contains 11.4% of portland cement with an optimum moisture content of 6.5%.
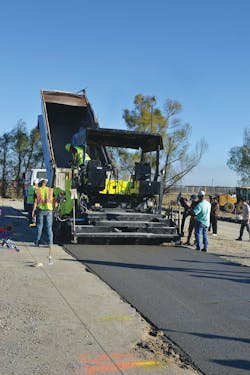
A high-density asphalt paver was used to place the RCC and achieve initial density.
Construction
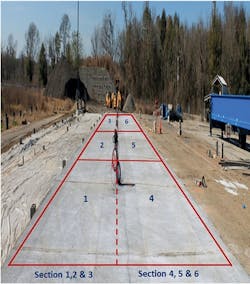
Six RCC test sections were designed to construct at PRF as shown in Figure 2. Three RCC slab thicknesses (4, 6 and 8 in.) and two base designs were utilized—a 150-psi unconfined compressive strength (UCS) cement-treated soil base with a thickness of 12 in. (Sections 1, 2 and 3) and a 300-psi UCS soil cement base with a thickness of 8.5 in. over a 10-in. cement-treated subgrade (Sections 4, 5 and 6). The 10-in. cement-treated subgrade contained a cement content of about 4%, or just enough to provide a dried stable working platform in which to build the stronger base. The two finished lanes consisting of six RCC test sections are shown in Figure 3. Each section is about 72 ft long and 13 ft wide.
All RCC sections were constructed in one day on two separate test lanes, each 215 ft long and 13 ft wide. RCC production was accomplished by using a twin-shaft pugmill operation on the paving site. A high-density asphalt paver was used to place the RCC and achieve initial density, and a 10-ton steel-drum roller was used for final compaction of the RCC pavement structure. Each lane included three test sections with RCC layer thicknesses of 4, 6 and 8 in. Paving started from an 8-in. section, moved to a 6-in. section and ended in a 4-in. section, using an in-between thickness transition zone approximately 20 ft long. All RCC layers were placed in a single lift and no construction joints were formed. Operation of saw-cutting joints began after RCC was hard enough to withstand spalling damage. The saw-cut joints were typically spaced at 20-, 15- and 10-ft intervals for the 8-, 6- and 4-in. RCC layers, respectively, with corresponding joint depths of 1.5, 1 and 0.5 in. Finally, a white-pigmented curing compound was sprayed on the finished RCC surfaces for curing.
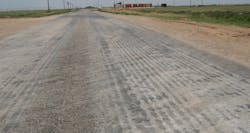
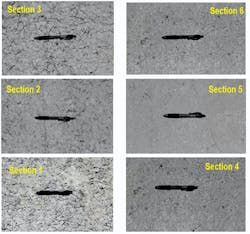
Figure 4 shows the surface characteristics of the constructed sections. Obviously, the surface textures for Sections 1-3 appeared much rougher than those for Sections 4-6. The measured International Roughness Index (IRI) results for Sections 1-3 were found significantly higher than the IRI results for Sections 4-6. This is most likely due to paver speed, as lane 1 was constructed in roughly two-thirds the time as lane 2, resulting in a rougher pavement surface. The IRI also is increased due to the frequent change in pavement thickness as the lanes were paved. Each section is roughly 70 ft in length, leading to frequent pavement-thickness transitions. It is believed that in an actual construction project, IRI values would be equal to or lower than the results from Section 5 in a range of 100-120 in. per mile.
Diagram of the two finished lanes consisting of six RCC test sections.
Accelerated loading test
A heavy vehicle load-simulation device, ATLaS30, was used to load the constructed RCC test sections. The ATLaS30 is designed to model one half of a single truck axle with dual tires inflated to a tire pressure of 130 psi.
The accelerated loading test started off on Section 4, followed by Section 5, Section 6, Section 3, Section 2 and Section 1 in a time-sequence order. Each RCC test section was loaded under ATLaS30 in an incremental loading sequence of 9, 16, 20, 22, 25 and 27.5 kips until reaching pavement failure. In the end, four RCC sections (Sections 2, 3, 5 and 6) loaded to a cracking failure, as the final pavement surfaces.
The overall accelerated loading results showed that all thin RCC test sections had a high load-carrying capacity under a typical southern Louisiana pavement condition. According to the 1993 AASHTO’s equivalent single axle load (ESAL) factors, the equivalent pavement fatigue lives in terms of estimated ESALs were 19.4, 2.4, 87.4, 19.2 million for Sections 2, 3, 5 and 6, respectively. The estimated pavement lives appeared to match well with the individual pavement structure strengths, that is, a thicker RCC over a strong base would provide longer pavement lives. Since each RCC section had endured a certain number of extremely high axle loads (i.e., an equivalent single axle load range of 18-55 kips) before a fatigue failure, such high RCC fatigue lives proved the feasibility and suitability of using a relatively thin RCC pavement on low-volume roadways where heavy/overloaded trucks are often encountered.
The development of surface cracks on a thin RCC test section under the ATLaS30 wheel loading are illustrated through crack mapping. The surface crack began in a longitudinal direction and became noticeable after 1,050,000 load repetitions. After more loading passes were applied, the first group of longitudinal cracks extended and merged into a major longitudinal crack closely located at one edge of the right tire print. Meanwhile, two other longitudinal cracks outside from the tire prints also developed. The longitudinal cracks gradually propagated, merged together diagonally, and eventually resulted in a fatigue failure mode on the surface of the thin RCC test section with extensive surface cracks.
A post-mortem trench evaluation was performed at the end of APT testing on the four failed RCC pavement sections. It was observed from the trench evaluation results that the load-induced cracks on thin RCC pavements could be either top-down or bottom-up initiated. Some saw-cutting joints could be cracked through first under wheel loading due to a relatively thinner slab thickness. Voids could be formed under a surface crack.
According to the results from the crack mapping and post-mortem trenches, the cracking failure mechanism for a thin RCC over a soil cement or cement-treated soil base pavement may be summarized as the following:
- The repeated heavy axle loads would first crack through saw-cutting joints of a thin RCC layer (possibly due to the bottom bending), and subsequently create pumping actions at the cracked joints under a wet condition;
- The pumping-out of fine materials would gradually weaken the overall pavement strength by forming voids in the base under or near the joints; and
- Continuously heavy wheel loading over a weak subgrade and/or voided base locations would start to break a thin RCC slab longitudinally and eventually result in an overall fracture failure due to the repetitive fatigue bending as well as the temperature-induced slab curling, especially under a naturally warm and wet southern Louisiana pavement condition.
Figure 4. The surface characteristics of the test sections.
Thin and strong
To illustrate a potential benefit of using a thin RCC pavement in lieu of an asphalt pavement alternative for low-volume roadways in Louisiana, a construction cost analysis was performed on two pavement structure alternatives. Pavement A consisted of a 5-in. RCC over an 8.5-in. soil cement. Pavement B had a similar base and subgrade structure as Pavement A, but it used a 7-in. hot-mix asphalt (HMA) as the surface layer. According to the 1993 AASHTO pavement design guide as well as the loading results from this study, both pavement structures would be expected to have at least a pavement life of 1 million of 18-kip ESALs.
The construction costs of two pavement alternatives were determined from the previous construction costs in Louisiana experiments. The quantities were calculated based on a 1-mile-long, 13-ft-wide lane. The estimated construction costs for Alternatives A and B were $198,082 and $311,169, respectively. Therefore, by using a 5-in. RCC in lieu of a 7-in. HMA layer, the estimated cost benefits would be $113,087 per lane-mile. Applying the estimated cost benefits to a typical two-lane, 10-mile-long roadway project, the use of a 5-in. RCC layer in lieu of a 7-in. HMA layer results in a total construction cost savings up to $2,261,740.
Overall, the results showed that a thin RCC over soil cement-pavement structure has a superior load-carrying capability. The 6-in. RCC sections carried an estimated 87.4 million and 19.4 million ESALs to failure for the strong and weak base, respectively. By using a thin RCC in lieu of an HMA layer for a low-volume pavement where heavy or overloaded trucks frequently travel in Louisiana, not only can it be cost-effective in construction, but it also could potentially extend pavement service life with less of a maintenance need.
About The Author: Wu is an associate professor of research and the Accelerated Pavement Research program manager. Rupnow is the associate director of research. Both are with the Louisiana Transportation Research Center.
