Evaluating the effectiveness of safety performance functions for public roads
By: Stephen Stapleton
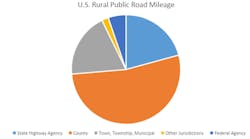
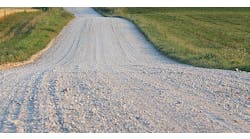
According to the Federal Highway Administration’s (FHWA) Office of Highway Policy Information, nearly 53% of rural highway mileage is under county ownership, with most county-owned roads not receiving federal aid (1). Title 23 of the United States Code requires states to spend at least 40% of federal safety funding on local highway safety programs, and requires that state highway safety plans be evidence-based and supported by data (2). Local and county-owned roads dominate the rural highway network in the U.S. in terms of mileage, as shown in the following figures. More than two-thirds of public road mileage in rural America are local roads, and more than half of rural mileage is under county ownership. Furthermore, most rural roads are not classified as federal-aid. Unpaved roads make up a small but substantial part of the rural roadway network. In spite of this, agencies are currently forced into using safety performance functions (SPFs) developed for state-owned arterial roads to make safety funding decisions, because SPFs specific to other categories of highway are few and far between in the current body of research.
Previous studies comparing the calibration of SPFs contained in the Highway Safety Manual (HSM) with recalculation have shown that different local conditions not only change the magnitude of the SPFs, the shape of the model changes as well (3). This is not surprising, as differences in population, access to medical services, and other intangible differences will affect the relationship between traffic volume and crash estimation. Geography is only one factor which will influence this relationship. Different functional classifications of highway, for example, have different driver characteristics (e.g., local versus long-distance, commercial versus personal, etc.). The agency that owns a road, as well as its funding source, is often strongly correlated with a particular functional classification. For instance, among the sample that the Michigan State University research team used in developing SPFs for federal-aid county-owned roads, 87% of segments were major collectors, but for non-federal-aid county roads, more than 80% of segments were local roads. In contrast, most state-owned roads are arterials. Due to the differences in functional classification, it stands to reason that if the model shape of SPFs change based on unobservable differences between states, ownership and funding source should have an impact as well.
THE PROCESS
A key reason behind the lack of evidence-based, data-driven tools specific to county-owned rural highways is a lack of accessible and reliable data. County road commissions (CRCs) are necessarily smaller than state DOTs, and therefore are less equipped to collect the quantity of data needed (both in terms of frequency of data collection and the number of characteristics collected), and oftentimes lack technological tools to organize the data they do have. The formatting of the data collected by agencies may be incompatible with each other, as well. All of these factors make it challenging to develop reliable SPFs for non-state-owned roads. Further still, because traffic volumes on county-owned roads are lower than on state roads, there are fewer crashes per mile, which introduces more error into the models developed as a result of smaller sample size.
While the Michigan DOT (MDOT) maintains a centralized database with volume, lane width, speed limit, and other pertinent factors for state-owned roads, the same does not exist for county roads. In Michigan, each of the 83 counties has its own CRC, which makes data collection even more challenging. On federal-aid county-owned roads, the state does record traffic volumes in a central database, but not other factors, which had to be collected from the counties themselves. Some data were collected by student researchers, including lane width and driveway density, using satellite imagery.
In total, the study evaluated approximately 6,500 miles of roadway, of which 78% were paved. There was a mix of paved federal-aid and paved non-federal-aid segments, which were evaluated separately. A third analysis was conducted to look specifically at both paved and unpaved low-volume (i.e., <400 vehicles/day, as defined by the HSM) non-federal-aid roads. Sixty-three percent of crashes comprised of deer-vehicle crashes (DVCs). As determining a causal relationship for DVCs was beyond the scope of this study, they were excluded from the analysis.Once the data set was complete, a random-effects negative binomial regression was conducted to determine the crash effects of various factors, including lane width, shoulder width, horizontal curvature, presence of lighting, and driveway density, among other factors. Not all factors originally considered were found to be statistically significant.
RESULTS
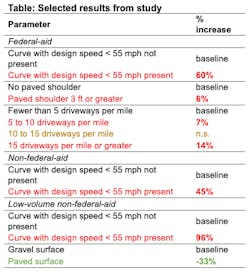
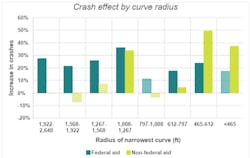
It was found that on rural, county-owned highways, horizontal curvature had the most consistent effect on crashes. Horizontal curves with a radius smaller than 1,008 ft (i.e., a curve with a design speed lower than the statutory speed limit of 55 mph in Michigan) showed a 60% increase in crashes on federal-aid roads, a 45% increase on non-federal-aid roads, and a 96% increase on low-volume roads (see table below). Interestingly, though, when curve radii are categorized (see figure below), we see that on federal-aid county roads, segments with curves of a radius from 1,008 ft to 1,267 ft, within design standards for 55 mph roads and not requiring a supplemental speed advisory plaque, see the largest increase in crashes. On non-federal-aid segments, segments with curves of a radius from 797 ft to 1,008 ft actually saw a decrease in crashes. While a sign inventory was not available, it seems likely that curve warning signs, required on curves of this radius, contributed to this decrease, as well as chevrons and other additional signage. More recent research has found that, while non-deer crashes increase along horizontal curves, DVCs decrease along curves (4).
Another interesting finding was that segments with a paved surface experienced 33% fewer crashes than gravel roads on low-volume roads when the volumes are equal. It should be noted, however, that this was a cross-sectional study, not one comparing before-and-after conditions.
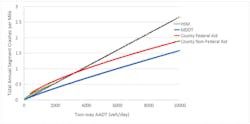
Lastly, it is worth seeing if the original assumption, that jurisdiction and funding source affect not only the magnitude of the model but the shape as well, is true or not. The figures below show the crash estimates based on the fully-specified SPFs developed for this project (5) (i.e., county federal-aid and county non-federal-aid roads), the SPFs used by MDOT on state-owned roads (6), as well as those provided in the HSM (7). It can be seen that the models for county-owned roads have a markedly different shape when compared to MDOT and HSM models. Simple calibration of HSM models would then lead to an underprediction of crashes for most volumes, making effective network screening impossible.
CONCLUSIONS
This study confirmed the original hypothesis—that jurisdiction and funding source affect model shape. This means generating SPFs from scratch will be more accurate than calibrating the SPFs contained in the HSM or other SPFs generated from state-owned roads. While developing SPFs is a laborious process, it only needs to happen once—once an agency determines the model shape for a particular classification of highway, they can calibrate those models in future analyses.
Some other key findings were that horizontal curves led to an increase in crashes, as expected, but the greatest increase in crashes was actually found among curves that meet design standards and do not require curve warning signs with supplemental speed plaques, indicating that curve warning signage is effective. Lastly, at equal volumes, paved highways experience fewer crashes than gravel.
---------------
References:
1) “Highway Statistics 2017.”
2) Title 23, United States Code.
3) Gates et al., “Safety Performance Functions for Rural Road Segments and Rural Intersections in Michigan.”
4) Stapleton, Ingle, and Gates, “Characteristics Contributing to Vehicle-Deer Crashes on Rural Two-Lane Roadways in Michigan.”
5) Stapleton et al., “Safety Performance Functions for Rural Two-Lane County Road Segments.”
6) Gates et al., “Safety Performance Functions for Rural Road Segments and Rural Intersections in Michigan.”
7) National Research Council (U.S.), American Association of State Highway and Transportation Officials, and National Cooperative Highway Research Program, Highway Safety Manual.
---------------
Disclaimer: Funding for this research was provided by MDOT. This publication is disseminated in the interest of information exchange. MDOT expressly disclaims any liability, of any kind, or for any reason, that might otherwise arise out of any use of this publication or the information or data provided in the publication. MDOT further disclaims any responsibility for typographical errors or accuracy of the information provided or contained within this publication. MDOT makes no warranties or representations whatsoever regarding the quality, content, completeness, suitability, adequacy, sequence, accuracy, or timeliness of the information and data provided, or that the contents represent standards, specifications, or regulations.
About The Author: Stapleton is with the Department of Civil and Environmental Engineering at Michigan State University.


