By: Kris Cousino, P.E.; Contributing Author
The city of Toledo, Ohio’s Division of Streets, Bridges and Harbor was hit hard with challenges when, after two consecutive milder-than-normal winters, Winter 2013-2014 came barreling down with record-breaking low temperatures and snow that wouldn’t quit. Double the average amount of storms, salt usage, snow and ice program cost, and total snow amounts caused Toledo to take the No. 1 ranking for worst winter in the U.S. by The Weather Channel.
One tool the Division uses in its planning that has become extremely helpful is a storm model. A storm model is a picture form used to easily convey to city leaders what road conditions will look like through an upcoming storm event. These storm models help city leaders determine what course of action to take when issuing alerts to the traveling public.
The use of the storm model had its beginning on Feb. 14, 2007. Toledo was experiencing blizzard-like conditions with heavy snowfall and strong winds. The Division had over 100 plows out on the roads doing the best possible job. Commissioner David Welch received a call from the County Sheriff’s office to meet downtown as soon as possible. Welch, being literally knee deep in snow himself, sent Kris Cousino to find out what was required of the Division.
This was a highly unusual request. Typically, county and city plow their paths, so to speak. Why did the Sheriff’s Office require immediate, outside attendance? After a difficult drive down the snowy roads, Cousino entered the Sheriff’s office to find the city of Toledo fire chief, police chief and mayor’s staff already in attendance. Quickly they relayed their concerns. Ambulances were getting stuck. Police cruisers were getting stuck. They demanded to know what the Division was doing about the problem. When would the roads be cleared? They needed a plan.
Cousino was a fish out of water. Here were all of the city leaders in one room looking at her for direction. For a brief moment she was stunned. However, as an engineer, she simply went with what she knew best. Give them the facts numbers and graphs. She grabbed a piece of paper and drew time along the x axis and predicted rate of snowfall along the y axis. A bell curve was drawn representing the storm at hand. Then she drew a couple of horizontal lines across the graph and began her explanation. She pointed to where the lines intersected the curve and showed how the slope of the curve increased as storm intensity increased. It was quickly made apparent that this was not a typical storm. The eye of the storm had not yet arrived and snow rates were expected to exceed 1 in. per hour, a very rare occurrence for the city of Toledo. The roads were not going to be cleared any time soon. In fact, conditions would be getting worse, much worse, before it got better. It would help if people would stay off the road. Heavy traffic and cars stuck in snowdrifts would only make plowing more difficult.
Now that the County Sheriff could see on paper a picture of what he was dealing with, he was able to come up with a plan. It was time to call a Level 3 Emergency for the city of Toledo. This was the first Level 3 Emergency declared for the city as a result of severe snow.
Standard practice
The Ohio Revised Code sets up the power and duties of the County Sheriff. In 1986 these powers were clarified to include authority to close county roads due to extreme weather conditions, and in 1997 these powers were further clarified to include municipal roads as well. Road emergency levels are declared through radio and television media as well as social media. Level 1 Emergency is called when the roads are hazardous. This could be black ice or blowing and drifting snow in open rural areas. Level 2 Emergency defines roads as being hazardous; people are encouraged to stay off the roads. This level is typically called when roads are snow-covered, with tracking and curb lines, medians and street signs difficult to see. A Level 3 Emergency closes roads to all non-emergency personnel. Any unauthorized vehicles on the road will be pulled over and may be subject to arrest.
Figure 1. A snow model was created after a bad event in 2007.
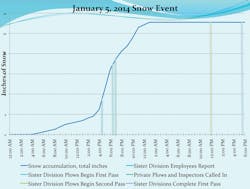
Figure 2. The rate of snowfall on Jan. 5, 2014.
After the Feb. 14, 2007, event, it became standard practice for the Division to produce a storm model prior to each major snow event. More and more people wanted to see these models to help with their own planning needs; it was, therefore, of crucial importance that these storm models be accurate. Having some basic knowledge of meteorology, good contacts with local meteorologists, and access to current technology became a must.
Ohio has a large number of weather stations in the Northwest region surrounding Toledo. Approximately 15 of these weather stations are in Greater Toledo, with over 200 throughout Ohio. Via the Internet, data such as pavement temperatures, pavement condition (dry, wet, icy), relative humidity, dew point, wind speed and direction, and precipitation rate are a click away. Weather Sentry manages the data from the state weather stations and supplies roadway treatment recommendations. Weather prediction is displayed online in an hourly data table, which is used as a base for the storm model. From there, both local and national meteorologists are contacted from the computer or a smart phone, and detailed answers are provided in less than 15 minutes. Final tweaking of the storm model involves talking to meteorologists less than 24 hours prior to the storm.
Asking the right questions
Knowing the right questions to ask the meteorologists is key to getting the full information needed for accurate weather prediction. Important questions include asking for wind speed and direction so that the amount of drifting can be anticipated. Pavement temperature, wet bulb temperature, dew point and dry bulb temperature are closely monitored because those numbers will indicate when frost will occur or when snow will start to accumulate. A further crucial bit of information is the temperature in the dendritic growth zone. Within the cloud layer of the atmosphere, the temperature of the dendritic growth zone will dictate how large the snowflakes will form. Snowflakes grow best at -15°C. The amount of precipitation translated to snow can be a factor of 8-9 or as high as 20. The average multiplier for Toledo is 11.3.
Traditionally, prior to 2014, a factor of 10 in. of snow per 1 in. of rain was used for ease of calculation. However, an early December 2013 storm yielded a 17:1 ratio, tripling the amount of snow anticipated. Therefore, proper factors were specifically requested of the meteorologists, including where the eye of storm or dry slot will center, and whether a deformation band will form and where it will form. A deformation band is a segment of heavier snow at the tail end of a storm, common in the Toledo area, but sometimes not easy to predict. Another good question is the location of the lowest pressure point, because 150-200 miles north and west of the lowest pressure point will be the worst of the storm. Finally, the level of certainty is requested. What are the worst case, best case and most probable case? Answers to these questions help to mold the final storm curve. This is where black and white combine to make gray and create the final picture. From this picture, timing for the plow drivers to report to work can be established, taking into consideration that the smaller plows can’t push snow higher than 4 in. of accumulation.
The drydown
Once the storm has passed, the actual weather data is compared to the predicted weather data and included with an overall evaluation of the success of the snow- and ice-treatment operation. Toledo utilizes Accuweather to provide the actual hourly data in an Excel format in less than 24 hours. Getting the same data from NOAA takes more than 30 days, by which time its value has diminished. Storm debriefings need to happen much more quickly than that. The mayor’s office is then debriefed with a summary of what went right, what went wrong and what improvements will be made for future storms.
By 2014, the city of Toledo had grown used to seeing storm models predicting the rate of snow fall and was becoming confident in their reliability, especially within 24 hours of the start of an event. During the months of January, February and March of that year, when major storms were imminent, Mayor D. Michael Collins teamed with Sheriff John Tharp to call Level 3 Emergencies in advance of storms. This gave drivers a chance to finish errands and make it home safely, as well as provide notice to businesses so they could schedule their workers accordingly.
Mayor Collins’, who passed away in early February, leaving a legacy of successful winter-weather treatment policy, motto was “plan for the worst and pray for the best.” This proved to be the safest and most effective way to declare a Level 3 Emergency. When people were given sufficient notice, vehicles were off the road. Plows could drive at consistent speeds without having to dodge traffic or worry about queues at intersections. Roads were cleaned much more quickly. Traffic accidents were mitigated. Plow drivers had undeniable right of way, limiting city liability. Active storm modeling will continue to prevent accidents and potentially save lives for years to come. WM
About The Author: Cousino is senior engineer for the city of Toledo’s Division of Streets, Bridges and Harbor.


